
Government’s own modelling shows its CleanBC plan will dampen economic growth and set B.C.’s prosperity back more than a decade
According to the NDP government’s own modelling, implementing the CleanBC policy agenda to meet the province’s greenhouse gas (GHG) reduction targets will push B.C.’s economic growth down to the slowest pace on record, which in turn will substantially dampen economic prosperity and well-being by the end of the decade. Yes, you read that correctly. While difficult to believe, the provincial government is forging ahead with a set of policies that its own modelling shows will make B.C.’s economy $28 billion smaller in 2030 and set prosperity back more than a decade. This remarkable finding emerges from looking beyond the government’s glossy reports to the raw modelling results of the estimated economic impact of CleanBC policies commissioned by the province but studiously ignored in its public communication materials.
The government’s CleanBC Roadmap to 2030report builds on several earlier reports detailing how B.C. will reduce GHG emissions to 40% below the 2007 level by 2030 – just seven years away. The government undertakes a comprehensive modelling exercise annually to provide analytical rigour and evaluate the effectiveness of its policies. The work appears to have mostly focused on the trajectory of GHG emissions. But the province’s most recent modelling exercise was expanded to include economic activity (or total provincial income/GDP). To quantify the impact of CleanBC, GHG and GDP forecasts are done under a Reference scenario which only includes climate policies implemented up to July 2017 – when the NDP first assumed office. The same simulation is then made assuming the additional suite of CleanBC policies adopted after July 2017 are in place. The difference between the two scenarios represents the policy impacts of the measures implemented by the Horgan and Eby governments.[1]
An important benefit of macro-modelling is that it provides order-of-magnitude estimates to inform policy makers and presumably the public about the impact of different policies; this kind of information is especially valuable when considering policies likely to have large and economy wide implications. In its public-facing CleanBC Roadmap publication, the government mainly focuses on expected GHG emission reductions. Very little attention is given to the associated economic impacts. The document does note that “Roadmap initiatives [will] generate approximately 18,000 direct and indirect jobs with GDP increases of 19%...” While it is not clear from the text, these figures appear to refer only to new jobs and new GDP generated by Roadmap initiatives.[2]They do not account for job losses or reduced GDP that result from the rapidly increasing B.C. carbon tax and other climate policies. That is, the GDP and employment numbers in the publication do not reflect the full, or importantly in this case, the net economic impact of CleanBC.
What are the expected broader impacts of the province’s climate policy agenda? It seems like a perfectly reasonable question. Yet the report only makes fleeting reference to slower growth or net impacts on the economy when it observes the Roadmap “…will increase the cost of fossil fuels,” and that “government will minimize the impacts by continuing the Climate Action Tax Credit and providing increased support to help people and businesses reduce emissions and costs.” Apart from this handful of words, there is no further discussion of CleanBC’s economic implications, positive or negative, anywhere else in the 66-page report.
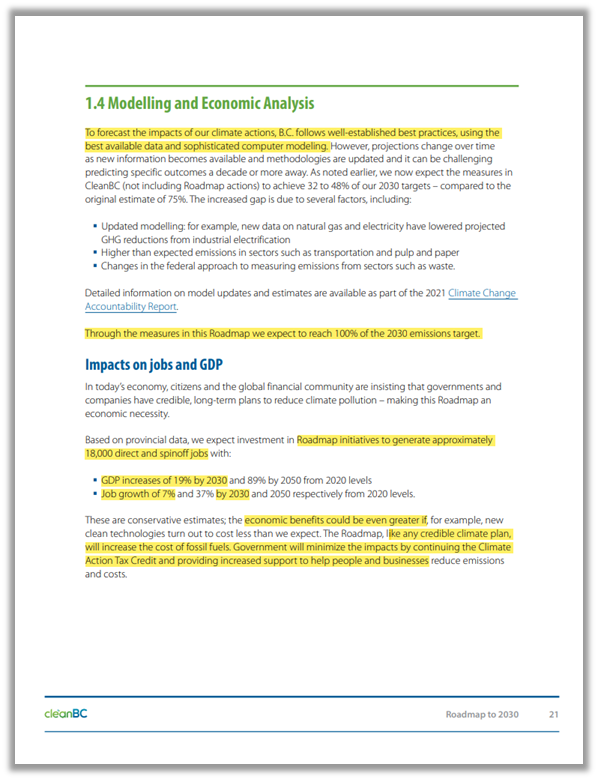
An image of the entire Modelling and Economic Analysis section in the CleanBC Roadmap document is reproduced below (highlights added), so readers can see for themselves how incomplete (bordering on deceptive) the description of the modelling results in the public-facing report is.
Impact on economic growth and prosperity
Answering questions about the broader economic impact of CleanBC requires a little digging. Some of the modelling results are reproduced in an Excel file and posted on the Ministry of Environment’s website. Importantly, the file includes projections for GHGs and provincial GDP (and provincial energy use) for the Reference scenario and the CleanBC scenario (which includes modelling all climate action policies since mid-2017). A truncated summary of the modelling results (taken directly from the Excel spreadsheet) is reproduced below. For convenience, thedifferences between the two scenarios are shown on the right. The topline result is that the government’s own modelling finds that CleanBC Roadmap policies will result in B.C.’s economy being $28.1 billion smaller in 2030 than would be the case in the absence of its additional policies.
Table 1: Government’s modelling results of the economic impact of CleanBC policies
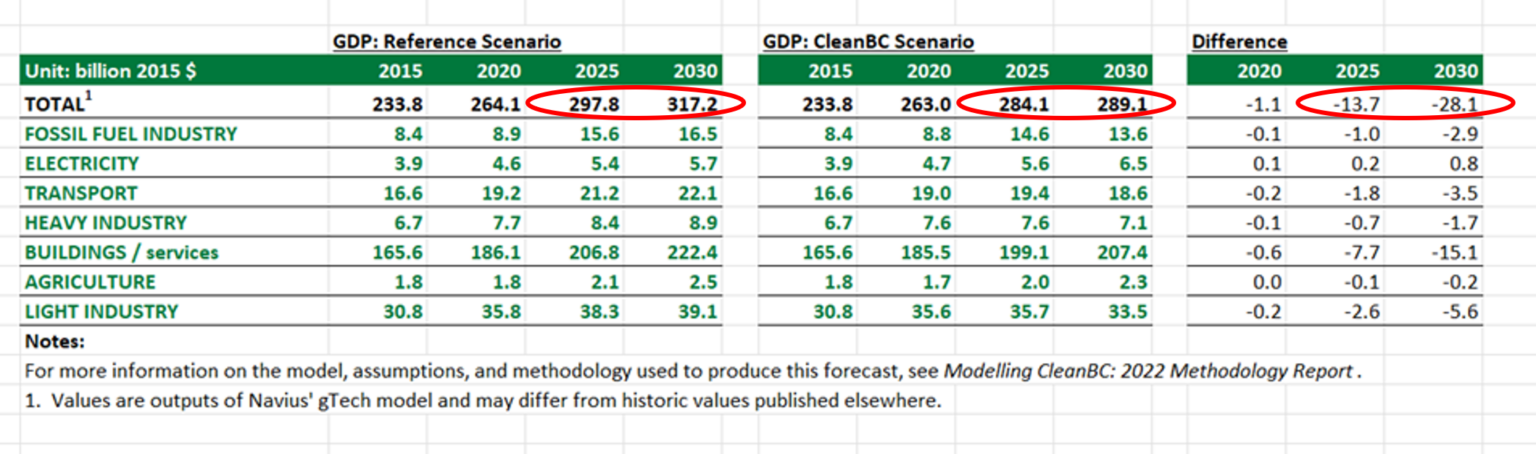
This is a sizable difference. Rather than growing by 20% under the Reference scenario, B.C.’s economy grows by less than 10% between 2020 and 2030 under the CleanBC scenario. Most of the growth slowdown and the hit to provincial income (GDP) occurs in the second half of the decade (2025-30), when the provincial carbon tax is slated to climb to $170/tonne and the many other GHG emission reduction measures and programs have been implemented.
Figure 1
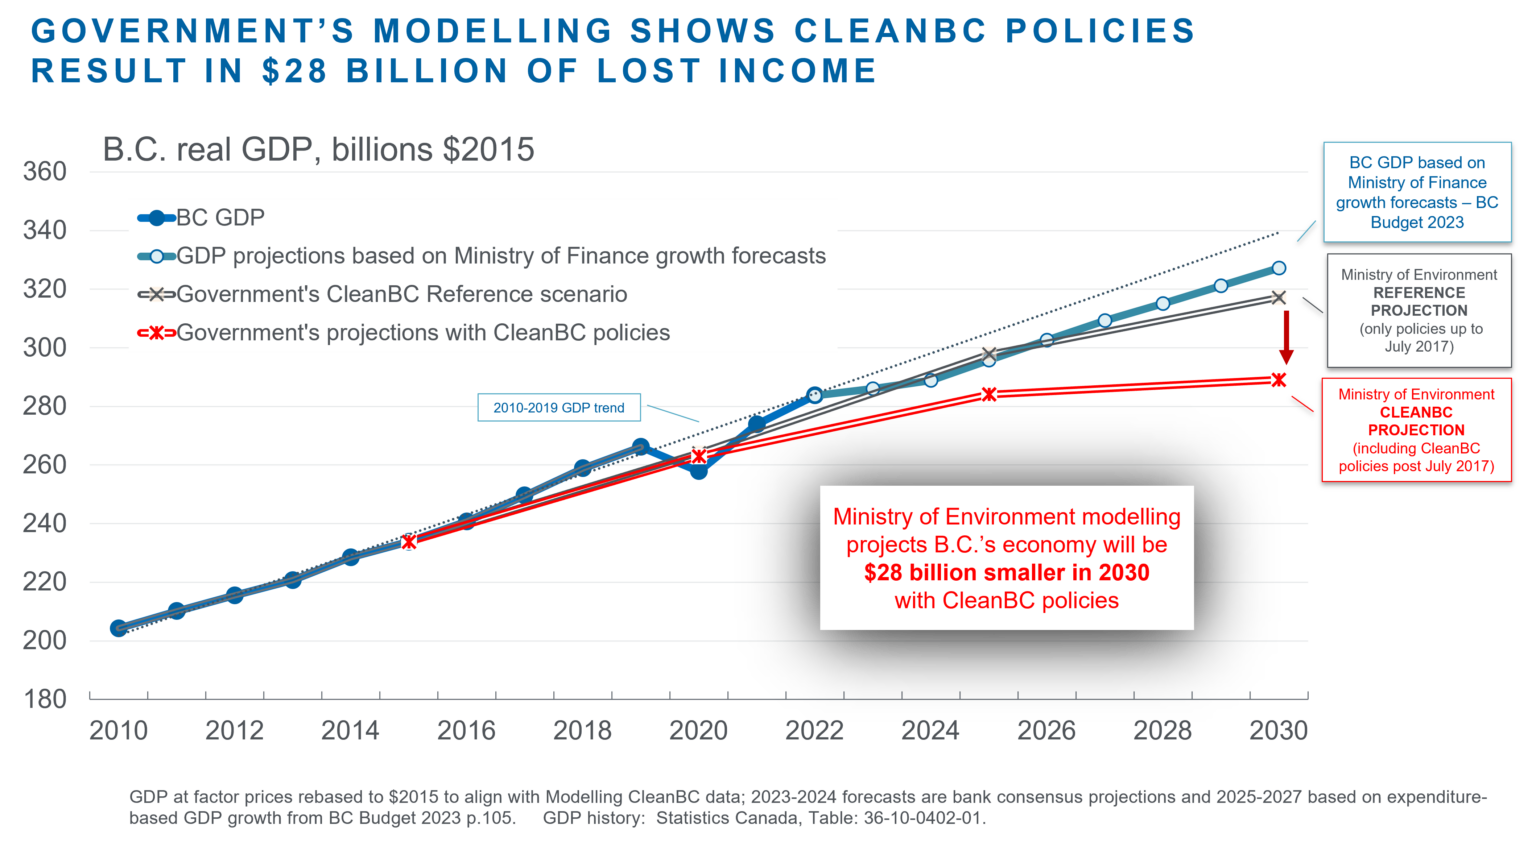
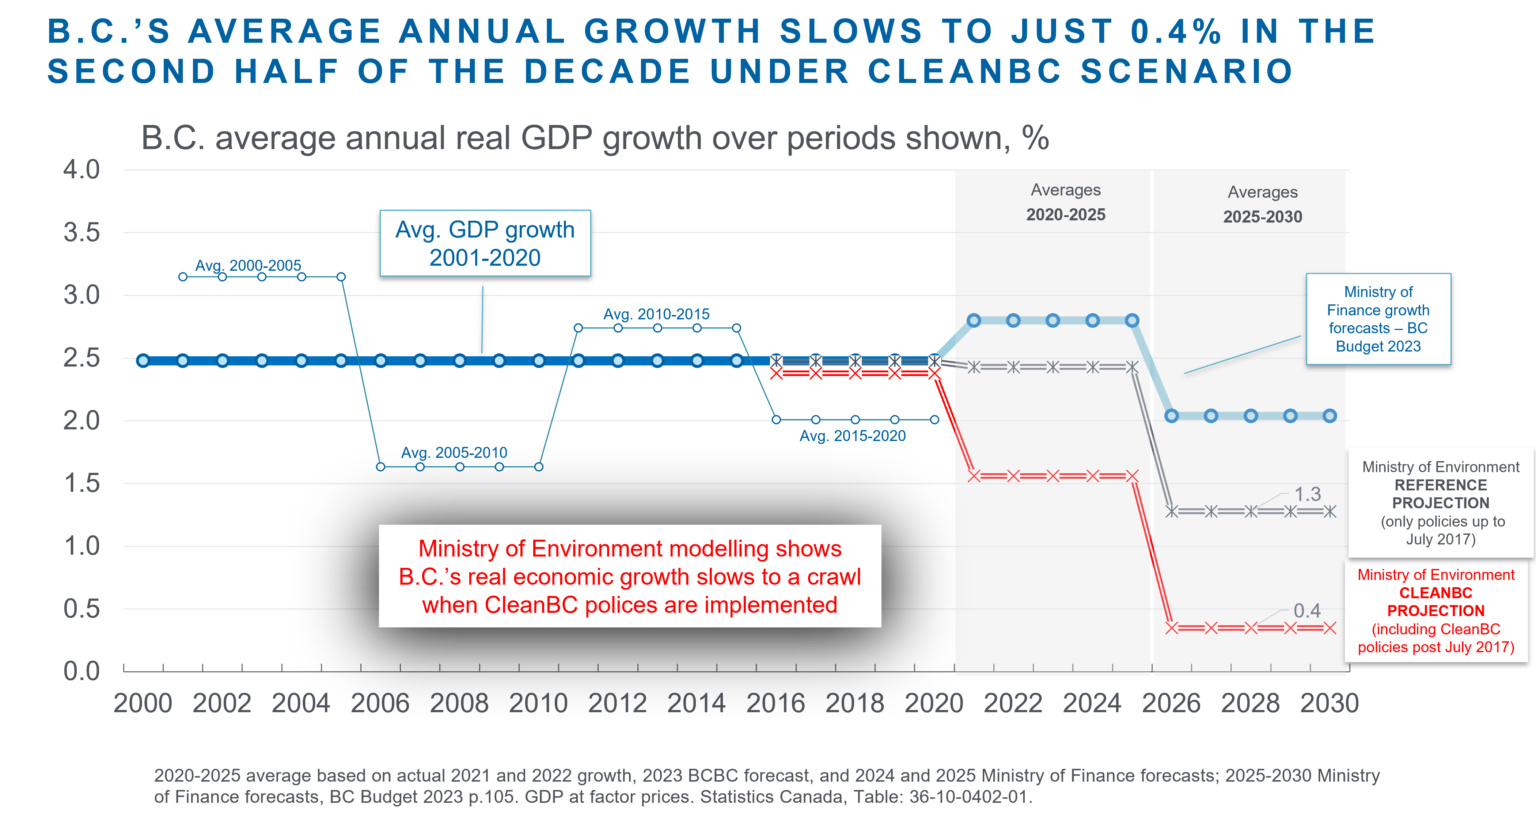
Figure 2 below shows the implied average annual real GDP growth rates under the government’s two scenarios. It also provides historical context: the heavy dark blue line is B.C.’s average annual real GDP growth rate over two decades (2001-2020) and the thin dark blue line shifting above and below the long-term average shows the average annual growth rates in five-year sub-periods. The strong economic expansion in the early to mid 2000s is evident. The financial crisis and 2008-09 great recession pulled average growth down to 1.6% in the 2005-2010 period. Growth was stronger in the recovery years of the early 2010s. And over the 2015 to 2020 period, the sharp pandemic-induced downturn in 2020 pulled the average growth rate down.
Additional context is provided by the five-year average projections (shown in the thick lighter blue line) that are from the private sector and the Ministry of Finance and thus independent of the Ministry of Environment. The average growth forecast for the 2020-2025 period is based on actual growth in 2021 and 2022, the current consensus forecasts for 2023 and 2024, and the B.C. Ministry of Finance forecast as reported in the 2023 Budget for 2025. Average annual growth is strong in this period because of the rebound from the pandemic in 2021 as well as buoyant commodity markets in some years, strong population growth, and the lift from large capital projects in 2021 and 2022. The projected 2025-2030 average growth rate is based on Ministry of Finance forecasts.
Figure 2

Turning to the Ministry of Environment’s modelling results. In the Reference projection (the grey line in Figure 2), between 2020-2025 B.C.’s economy grows in line with the long-term average. But over the 2025-2030 period, economic growth falls to an average annual rate of only 1.3%. This slowdown suggests that even the policies put in place prior to July 2017 are sufficient to push B.C.’s economic growth rate below its long-term average and well below what the Ministry of Finance projects in its most recent Budget.
When the post July 2017 CleanBC policies are incorporated into the modelling, B.C.’s average annual economic growth falls by nearly a full percentage point in both five-year sub-periods. Especially concerning is the projection that average annual real GDP growth will slow to just 0.4% in the 2025-2030 period. This means the CleanBC Roadmap policies, according to the government’s own analysis, will put the province on a path for the weakest economic growth in its history!
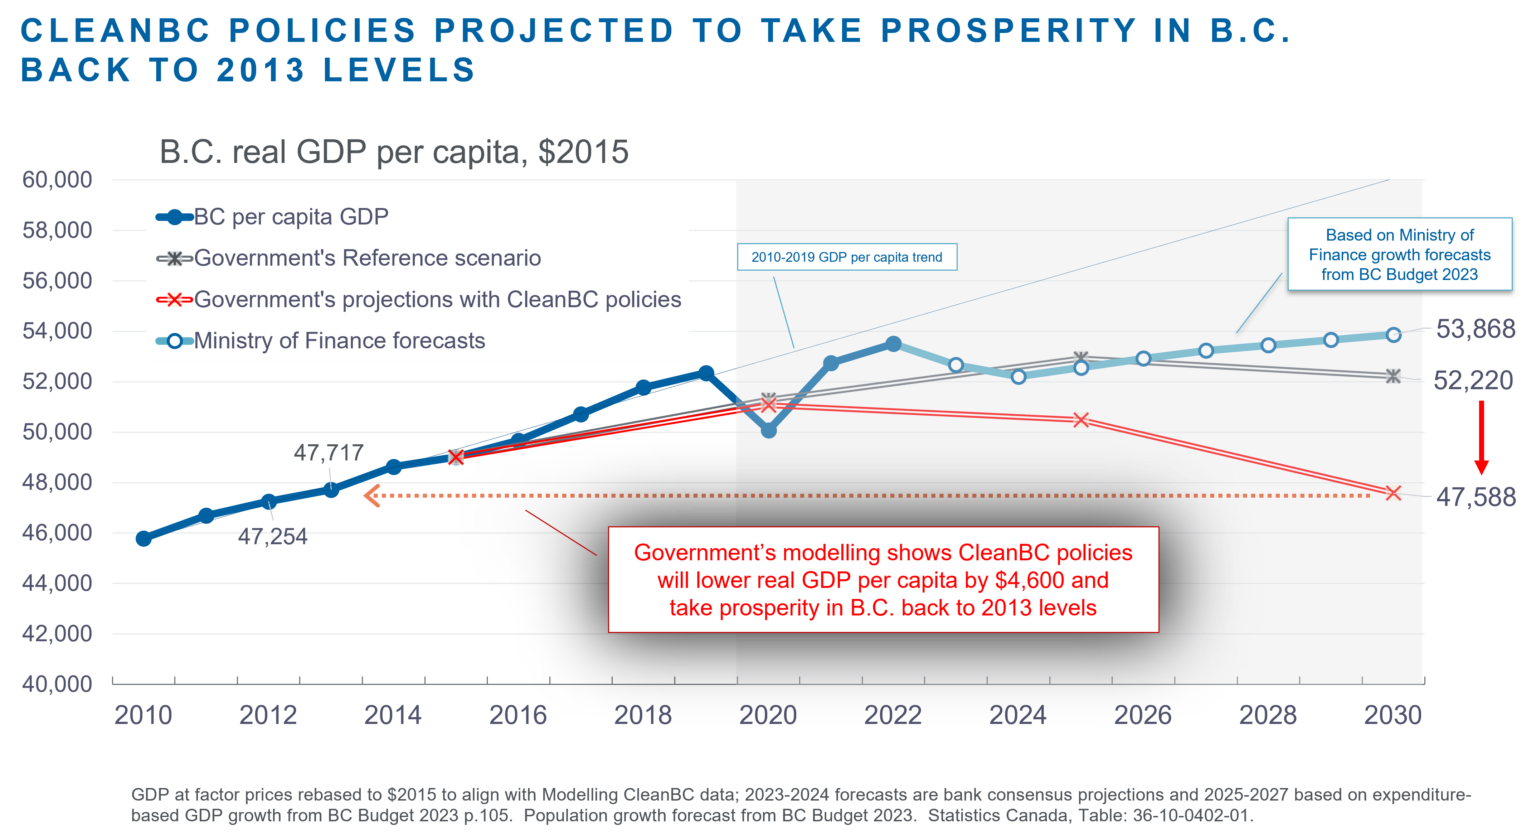
The implication for B.C.’s prosperity is not comforting, to say the least. With the economy barely growing, even modest increases in the size of B.C.’s population translate to serial reductions in per capita income. Using the population forecasts included in the 2023 Provincial budget, with the CleanBC policies in place real per capita GDP will decline throughout the decade[3]. The decreases are modest over 2020-2025 but accelerate in the 2025-2030 period to reach annual declines of 1.2%.
Figure 3
A decade of negative growth in per capita incomes compounds and has dire implications for economic well-being. By the end of the decade, the modelling of CleanBC policies suggests B.C.'s real GDP per capita will be $4,600 lower than it would be in the absence of the government’s expanded climate policy measures. A reduction in average income of this magnitude would take B.C.’s level of prosperity back to where it was in 2013.
Figure 4
The NDP government has embraced a policy agenda that aims to achieve dramatic reductions in GHG emissions over a relatively brief time frame. We have sympathy for the goals that have been enunciated: every advanced economy jurisdiction is and will remain under pressure to address its emissions. But the likely economic consequences of the province’s climate policies is a topic the government has generally preferred to avoid. The government has announced bold targets and endeavoured to model the resulting reductions in GHG emissions. What it hasn’t yet done is straightforwardly explain to legislators and the public that CleanBC will also dampen future economic growth and make B.C.’s economy smaller than it would be under a different mix of policies – results confirmed by its own (obscure) economic modelling. Years of slower economic growth will mean lower average incomes, fewer job opportunities, less government revenue, and a meaningful decline in B.C.’s overall prosperity.
[1] The Climate Action Secretariat prepares and publishes the Provincial Forecast annually, using modelling conducted by Navius Research. Each year, the modelling used to create the projections is updated with the most recent and accurate input data available. Navius is a Canadian energy and environmental consulting firm whose services are often sought by governments looking to advance aggressive climate policies.
[2] As indicated, it is not clear what the figures refer to. It is not overall GDP growth which the modelling shows will amount to less than 10% between 2020 and 2030. The 18,000 direct and indirect jobs over the decade translate into roughly 1,800 jobs each year, which is a small amount in a province where total employment exceeds 2.5 million. Even in a weak economic year for B.C. net job growth reaches 30,000.
[3] Budget 2023 forecasts population growth of 2.4% in 2023, followed by 1.9%, 1.7%, 1.6% in 2025, 2026 and 2027 and then 1.5% in the final three years of the decade.